
New announcement. Learn more

SupportHelpFeedLabelsFlexi-stockFeedSmartFeed demandGross marginAgFirstDairy FarmingWaikato Dairy FarmerHamish PuttDairy IntegrationOn-farm solutionsProduct releaseProduct inventoryBroadcast locationSpot sprayingFound stockSoil moistureSoil temperatureMeasure distancesMeasure by drawing on the mapEdit diary notesBlock groupsWeather ForecastTimesheetsStylingWeatherGPS trackingTask MappingOffline trackingNAITMobile farm appFarmIQ updatesAwardsFonterraOnenui StationTawapata SouthRocket LabAhuwhenua TrophyWeb appStock typeGoatsLossesKilled on farmSalesPurchasesBirthsPasture wedgeSafeVisitEIDRecordingFuel top upsLand notesAnimal/stock notesNotificationsMobile appTo-do listShopping listArtificial intelligenceAIWebDiaryTips and tricksWeaningIntegrationGallagherAnimal health treatmentsDairyLincolnRural Professional of the YearTreatmentsFertiliserChemicalsBatchesKennelsAssetsDogsTe PariMeet the teamTeam meetingRisksChecklistsTasksHazardsInjuriesIncidentsHealth and safetyMobileEventBetter Together podcastDoug AveryDroughtAutumnWormwiseGinny DodunskiDrench resistanceDrenchWormsSummerOut on the farmProductsProPerformanceEssentialsLitePacksFARMAXMob moveFarm planRegional councilRegulationsComplianceFreshwaterFreshwater Farm PlanRecordsMob historyMobsConsultantRural professionalFarmIQ awardFARMAX awardAwardEmerging Rural ProfessionalNZIPIMModellingScienceFarm technologyDataAnimal deathsDeathsPasture growthFarm walkPasture coversPasture heatmapDeferred grazingGrazingAgResearchPastureGrassEmissionsGreenhouse gasGHG
TAGS

New info-rich FARMAX reports in FarmIQ

The team has been working hard on enhancing the integration between FARMAX and FarmIQ, and we're excited to share that if you have both tools, you can now see FARMAX reports displayed in FarmIQ as info-rich widgets.

How the new widgets work

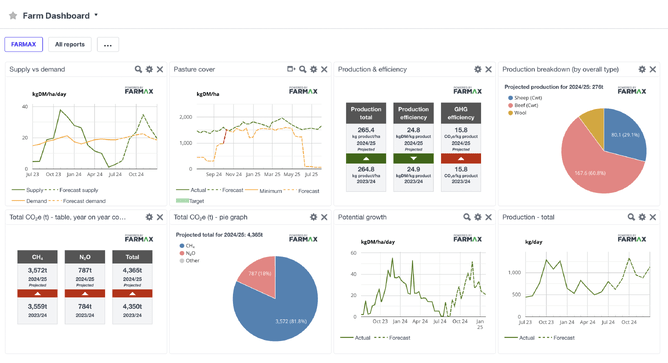
Dashboard data will be pulled from your FARMAX Monitoring file (FARMAX Advantage customers), for you to show in a series of widgets in FarmIQ. The widgets cover a range of feed, production and GHG KPIs, and include both forecasts for the remainder of the current season (July - June), as well as comparisons against the last season.

What the widgets show:

  • Pasture covers

  • Potential growth

  • Supply versus demand

  • Production breakdown

  • Production and efficiency

  • Total CO₂ year on year

  • Total CO₂ pie graph

  • Total production

  • And lots of other reports to choose from 

A view of all the FARMAX widgets on the FarmIQ dashboard

How to get set up

In order to see and use these widgets you need to have both FARMAX Advantage and FarmIQ Performance+ or Pro.

If you already have the integration connected, go to Office > Settings > External Company Access > Turn on FARMAX. This will turn on a widget in your FarmIQ Dashboard that will show the FARMAX reports.

You can customise your dashboard by selecting the specific reports you want to see.

Head here for instructions on setting up the integration on the FarmIQ side.

If you can't see the reports or if you need a hand setting up the integration, call one of the HelpDesks on 0800 327 629 or 0800 327 647.